Our previous streaming service blog focused on the negative impact that Netflix’s Q1 2023 password-sharing crackdown would have on subscriber sentiment (check it out here!). Since then, we’ve been monitoring our Longitudinal Survey to measure the impact of Netflix’s password crackdown as well as other events in the streaming service industry. Our Longitudinal Survey allows us to gather consumer insights and track sentiment in the streaming service industry over time with respect to company health, content evaluation, current usage, future trends, and many other metrics. Has Netflix weathered the password crackdown storm? Read on to find out!

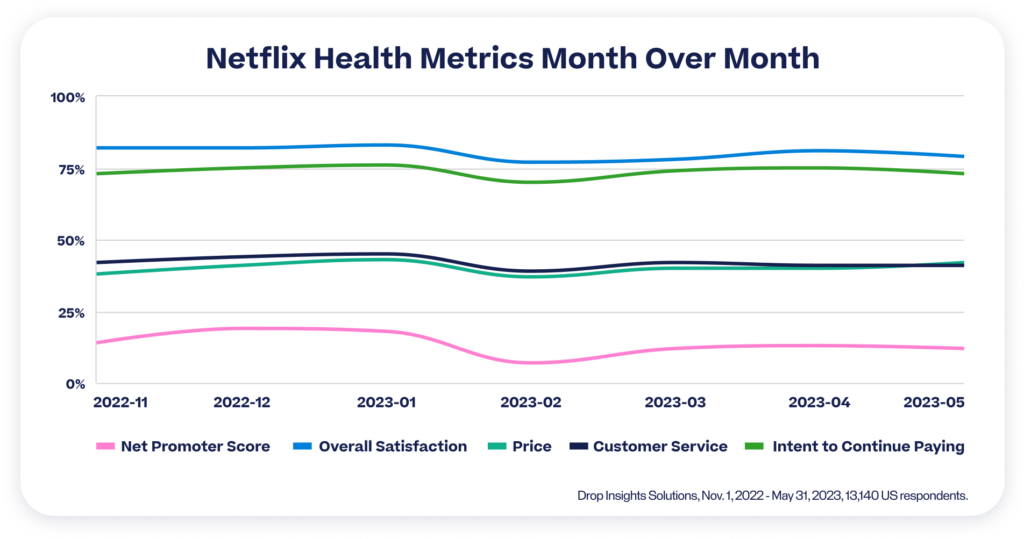
Netflix’s crackdown on password sharing created a dip in subscriber sentiment, but this already looks to have subsided in recent months with the majority of metrics bouncing back.
All health metrics included in Drop’s Longitudinal Survey experienced a 6% decrease for Netflix in February compared to January. Netflix’s NPS score took a larger hit dropping from 18% down to 7% placing the streaming service significantly lower than its top competitors Disney+ (18%) and HBO Max (17%) at that time. This February lull for Netflix is most likely a result of the password-sharing crackdown but in recent months all health metrics have begun to bounce back. Increases of at least 2% can be observed across the board for the health metrics but they are still inferior to the results recorded before the crackdown. Considering the huge impact of this crackdown, Netflix should be more than satisfied to see consumer sentiment already bouncing back. However, with the Longitudinal Survey respondents being US based this negative sentiment is just secondhand for now, and could be significantly worse when the crackdown is fully completed across all of North America by the end of July 2023.

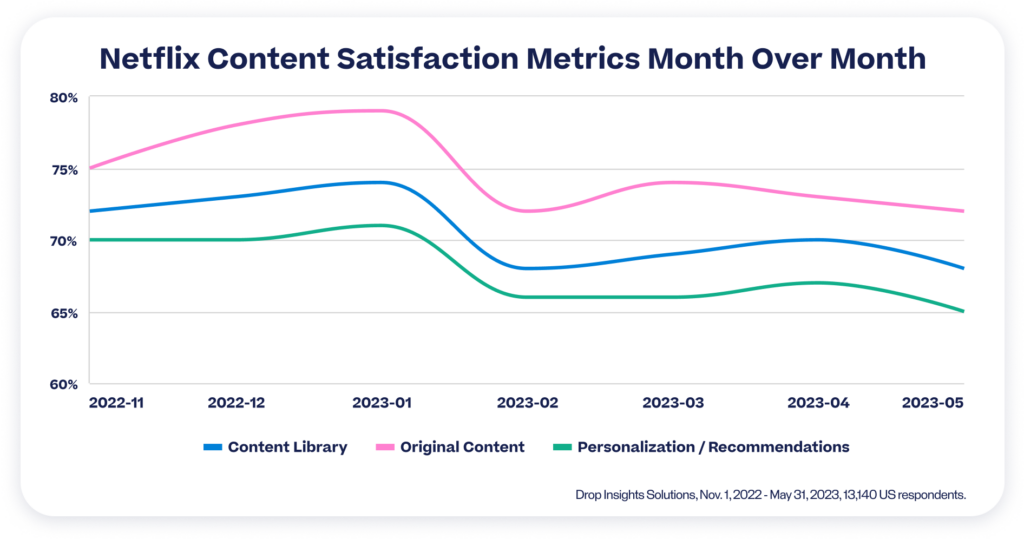
Netflix would have been hoping that its superior original and personalized content would help to offset any password crackdown negativity, but this doesn’t seem to be the case.
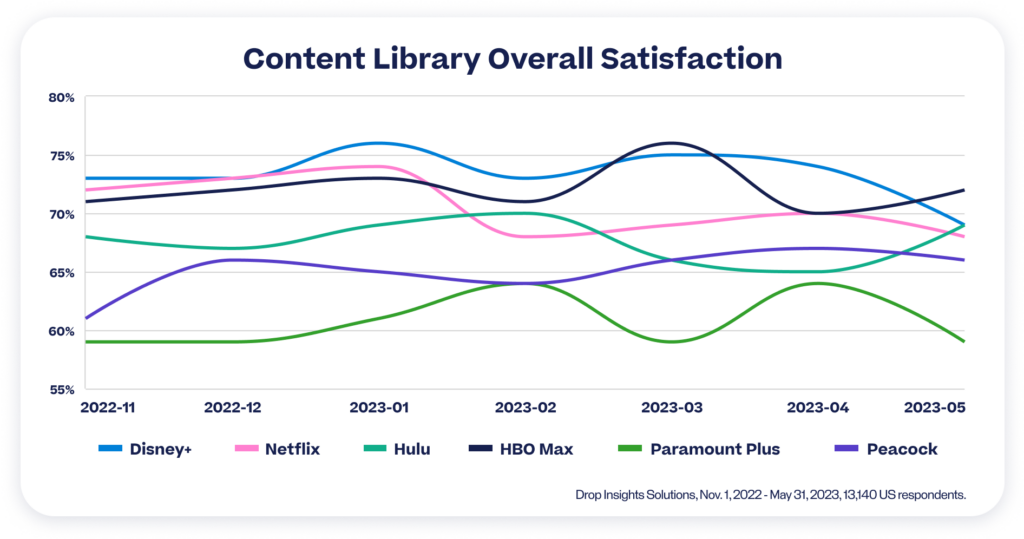
The Longitudinal Survey content metrics experienced a similar drop off to the health metrics for Netflix, approximately 6% across the board. Unlike the health metrics, however, the content metrics have not bounced back in the subsequent months and some have even decreased further. This is particularly surprising considering the password crackdown allows Netflix to obtain more accurate subscriber information which would allow the streaming giant to produce even more original and personalized content. It is possible that these benefits to the crackdown are not impacting US subscribers yet and new Netflix content isn’t delivering like it used to. Either way, this is a concerning trend for Netflix, as top-quality content is the key differentiator among streaming giants. Strong competitors like Max (previously HBO Max) are starting to pull Netflix down to the rest of the pack as Max topped the May Longitudinal Survey satisfaction results for content library and original content. Succession season 4 being the popular choice.

Netflix isn’t the only streaming service to experience a lull in recent months with many other services also navigating negative sentiment due to content removal.
Coming out of the COVID-19 pandemic, consumers are spending significantly less time at home and therefore have less need for streaming services. Some of the streaming giants are therefore being more strategic with the content on their platforms, removing material that requires residual payments or licensing fees. Removing content is not a new trend but in the past couple months Disney+ and Max have been large culprits which is reflected in the Longitudinal Survey data. Satisfaction with the content library dropped 5% for Disney+ in May and 6% for Max in April which correlates with the timing of their content removal. Other lulls can be observed over the past 6 months for different streaming services highlighting again the importance of content, and in some cases subscriber up roars have prompted providers to retract content removals.

Events in the streaming service industry have created negative subscriber sentiment but the Longitudinal Survey data has shown that streaming giants are able to bounce back. The Netflix password-sharing crackdown caused immediate dips in both the health and content metrics. This was to be expected but the surprising part is that the health metrics have started to bounce back whereas the content metrics have remained lower, even decreasing in some cases. Netflix’s hopes to leverage accurate subscriber preferences for more original and personalized content doesn’t look to have countered the impact of their password crackdown so far. The removal of content from other strong streaming platforms (Disney+ and Max) also is not sitting well with subscribers and will be a trend we continue to monitor with our Longitudinal Survey.
Stay tuned to see future trends in the streaming service industry as we leverage our Longitudinal Market Research Survey and other data resources! If you are interested in conducting longitudinal research in an industry of your choice, connect with sales@joindrop.com.
Ready to get started?
Tell us a little bit about how we can help.
This site is protected by reCAPTCHA and the Google Privacy Policy and Terms of Service apply.


