
In Q3 of 2021, off-price retailers like T.J. Maxx saw a +20% increase in combined sales compared to 2019.
Drawing from Drop’s Verified Debit & Credit Transaction Panel, our latest report dives into how T.J. Maxx’s revenue, shopper volume, customer loyalty and assortment measures up to its competitors and offers Drop’s take on whether T.J. Maxx’s growth will continue into 2023.
Here’s a sneak peak at some of the report highlights, but be sure to download the full report below.
Low prices and product variety drive customers to T.J. Maxx
Surprisingly, affordable designer clothes are not the #1 reason customers shop at TJ Maxx.
52.1% of panelists who shop at TJ Maxx shared that their main driver is the variety of merchandise, followed by lower prices on non-designer goods at 43.6%.
Interesting Insight: The most popular categories to shop for at TJ Maxx are: apparel and shoes 85.6%, accessories 57.7%, furniture and kitchen products 53.6% and bath and beauty 52.5%.
T.J. Maxx has loyal customers
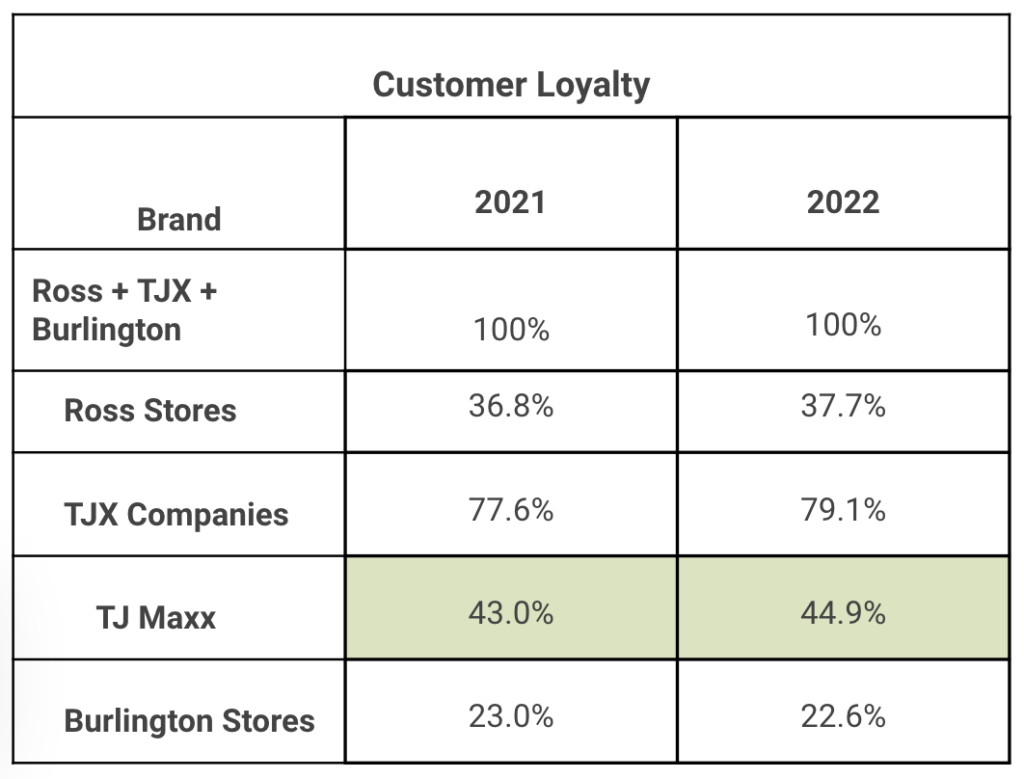
In 2022, customer loyalty across off-price retailers showed moderate gains across all brands with the exception of Burlington Stores.
T.J. Maxx demonstrated the strongest loyalty, both overall and in terms of absolute gains with an increase of +1.9%.
Get the full report.
Download the full T.J. Maxx Report below to drill down into the data and find out more on how T.J. Maxx is winning and to get Drop’s prediction on whether its growth is sustainable.
Ready for more? To access up-to-date custom sector reports with a daily cadence, and to view quantitative and qualitative trends that fuel your work, contact sales@joindrop.com.
Download the full T.J. Maxx Trend Report
This site is protected by reCAPTCHA and the Google Privacy Policy and Terms of Service apply.