Netflix’s Password Crackdown: A Temporary Dip or Long-Term Consequence?

Our previous streaming service blog focused on the negative impact that Netflix’s Q1 2023 password-sharing crackdown would have on subscriber sentiment (check it out here!). Since then, we’ve been monitoring our Longitudinal Survey to measure the impact of Netflix’s password crackdown as well as other events in the streaming service industry. Our Longitudinal Survey allows us to gather consumer insights and track sentiment in the streaming service industry over time with respect to company health, content evaluation, current usage, future trends, and many other metrics. Has Netflix weathered the password crackdown storm? Read on to find out!

Brand logos for Disney+, Netflix, HBO Max, Hulu, Paramount+, and Peacock.

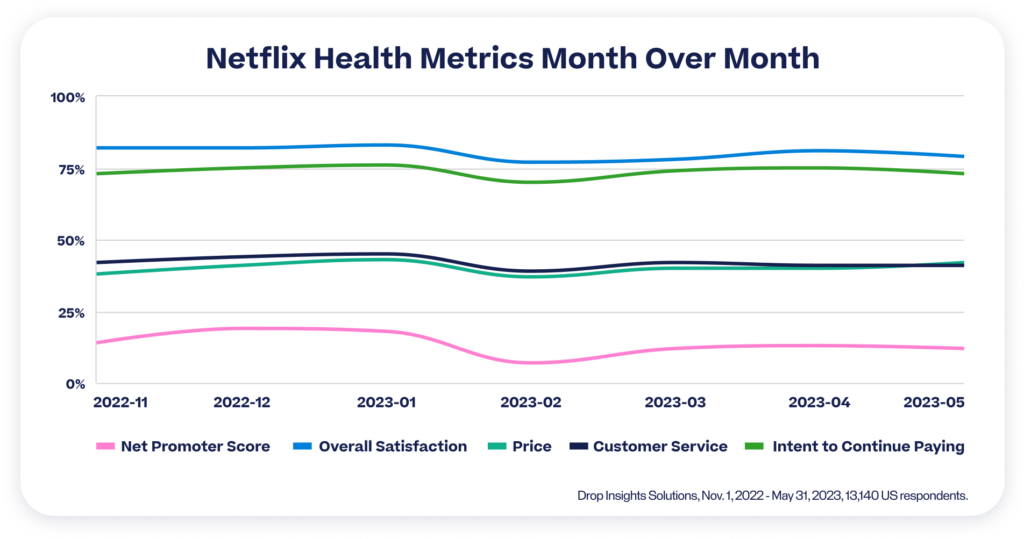
Netflix’s crackdown on password sharing created a dip in subscriber sentiment, but this already looks to have subsided in recent months with the majority of metrics bouncing back. 

All health metrics included in Drop’s Longitudinal Survey experienced a 6% decrease for Netflix in February compared to January. Netflix’s NPS score took a larger hit dropping from 18% down to 7% placing the streaming service significantly lower than its top competitors Disney+ (18%) and HBO Max (17%) at that time. This February lull for Netflix is most likely a result of the password-sharing crackdown but in recent months all health metrics have begun to bounce back. Increases of at least 2% can be observed across the board for the health metrics but they are still inferior to the results recorded before the crackdown. Considering the huge impact of this crackdown, Netflix should be more than satisfied to see consumer sentiment already bouncing back. However, with the Longitudinal Survey respondents being US based this negative sentiment is just secondhand for now, and could be significantly worse when the crackdown is fully completed across all of North America by the end of July 2023. 

Line graph displaying Netflix health metrics month over month.
Net Promoter Score – likelihood to recommend on a scale of 0-10. Score is calculated as Promoters’ share (scores 9-10) subtract Detractors’ share (scores 0-6). Overall Satisfaction, Price, Customer Service, and Intent to Continue Paying are all asked on a 5 point satisfaction scale. The graph is displaying the share of responses that were Very Satisfied or Satisfied (top 2 box) for Netflix.

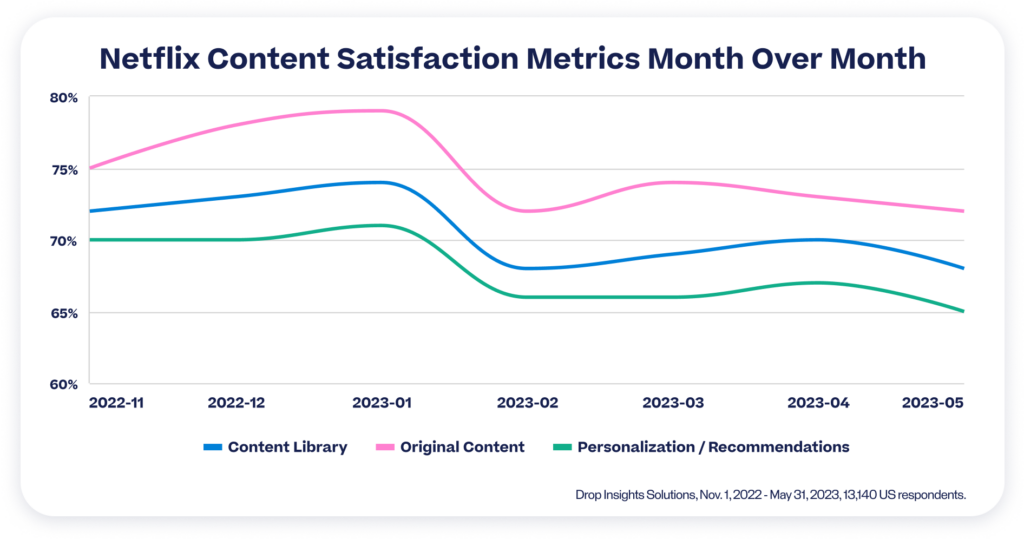
Netflix would have been hoping that its superior original and personalized content would help to offset any password crackdown negativity, but this doesn’t seem to be the case. 

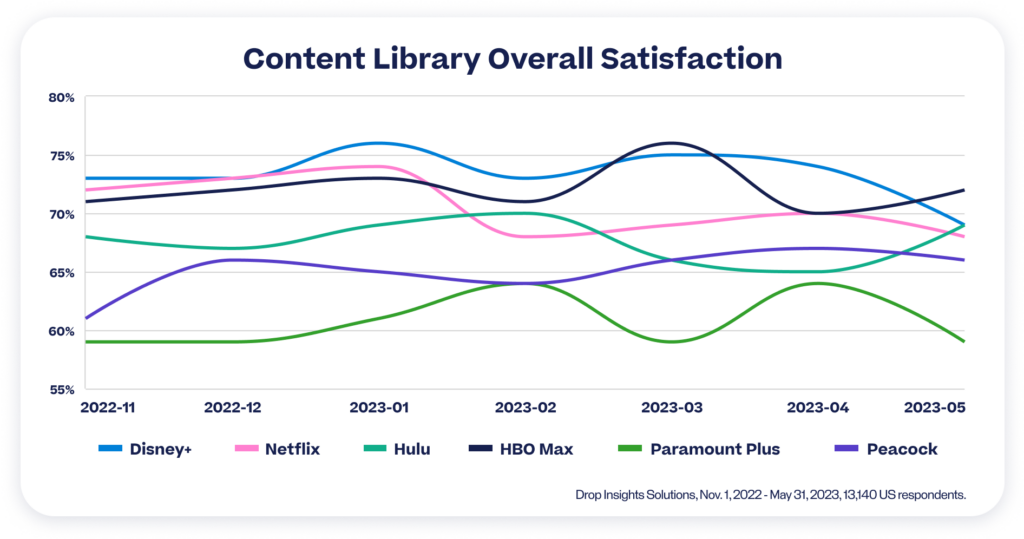
The Longitudinal Survey content metrics experienced a similar drop off to the health metrics for Netflix, approximately 6% across the board. Unlike the health metrics, however, the content metrics have not bounced back in the subsequent months and some have even decreased further. This is particularly surprising considering the password crackdown allows Netflix to obtain more accurate subscriber information which would allow the streaming giant to produce even more original and personalized content. It is possible that these benefits to the crackdown are not impacting US subscribers yet and new Netflix content isn’t delivering like it used to. Either way, this is a concerning trend for Netflix, as top-quality content is the key differentiator among streaming giants. Strong competitors like Max (previously HBO Max) are starting to pull Netflix down to the rest of the pack as Max topped the May Longitudinal Survey satisfaction results for content library and original content. Succession season 4 being the popular choice. 

Line graph displaying Netflix content satisfaction metrics month over month.
Content Library, Original Content, and Personalization / Recommendations are all asked on a 5 point satisfaction scale. The graph is displaying the share of responses that were Very Satisfied or Satisfied (top 2 box) for Netflix.

Netflix isn’t the only streaming service to experience a lull in recent months with many other services also navigating negative sentiment due to content removal. 

Coming out of the COVID-19 pandemic, consumers are spending significantly less time at home and therefore have less need for streaming services. Some of the streaming giants are therefore being more strategic with the content on their platforms, removing material that requires residual payments or licensing fees. Removing content is not a new trend but in the past couple months Disney+ and Max have been large culprits which is reflected in the Longitudinal Survey data. Satisfaction with the content library dropped 5% for Disney+ in May and 6% for Max in April which correlates with the timing of their content removal. Other lulls can be observed over the past 6 months for different streaming services highlighting again the importance of content, and in some cases subscriber up roars have prompted providers to retract content removals. 

Line graph displaying content library overall satisfaction for organizations in the streaming service industry.
The graph is displaying the share of responses that were Very Satisfied or Satisfied (top 2 box) for the streaming services included in the Longitudinal Survey.

Events in the streaming service industry have created negative subscriber sentiment but the Longitudinal Survey data has shown that streaming giants are able to bounce back. The Netflix password-sharing crackdown caused immediate dips in both the health and content metrics. This was to be expected but the surprising part is that the health metrics have started to bounce back whereas the content metrics have remained lower, even decreasing in some cases. Netflix’s hopes to leverage accurate subscriber preferences for more original and personalized content doesn’t look to have countered the impact of their password crackdown so far. The removal of content from other strong streaming platforms (Disney+ and Max) also is not sitting well with subscribers and will be a trend we continue to monitor with our Longitudinal Survey. 

Stay tuned to see future trends in the streaming service industry as we leverage our Longitudinal Market Research Survey and other data resources! If you are interested in conducting longitudinal research in an industry of your choice, connect with sales@joindrop.com.

Ready to get started?

Tell us a little bit about how we can help.

    Price Elasticity and the Resurgence of QSRs in the Food Service Industry

    Leveraging data from Drop’s 2023 Q1 Spending Report and a recent card-linked member survey, we have been able to uncover some interesting consumer insights into where diners are purchasing their food and the importance of price. Overall 2023 consumer spending is down and fast to moderate-speed restaurants look to be the preferred choice, but price increases or the appropriate discount could be enough to sway consumer behavior. 

    Total spend in Grocery stores and Restaurants decreased compared to last year, but QSR restaurants look to be the prevailing popular choice.

    Total spend at Grocery stores and Restaurants decreased 7% and 3% respectively compared to last year. The spend decrease was primarily due to fewer transactions for both, but the basket size at Restaurants increased slightly (+1%) whereas Grocery decreased slightly (-2%). The marginal price increases at most restaurants are likely creating a weaker drop-off in total spend. Top restaurants among Drop members in early 2023 are fast to moderate-speed restaurants rather than sit-down venues. As we approach a potential recession, QSR restaurants will likely become a popular choice again as we saw with the Great Recession.

    Bar graph displaying Restaurant Sector Total Spend Share (Top 5). The data was collected by Drop's card-linked marketing platform.

    Comparing all industries, Food Delivery is the most sensitive to price increases and Grocery is the least.

    For Food Delivery 40% of survey respondents would be willing to pay a <5% (lowest answer option) price increase before being deterred from purchasing, whereas for the majority of other industries, consumers are willing to pay a 5-9% increase. Grocery is the industry where respondents are least sensitive to price increases, 62% are willing to pay a 10%+ increase which is significantly higher than any other industry. Groceries are a product that consumers cannot go without and therefore are willing to pay significant price increases if required. Food Delivery is not a necessity and is already at a fairly expensive price point, so marginal increases are enough to sway consumers into changing their shopping habits.

    Maximum Price Increase Before Deterred to Purchase Vertical Stacked Column Graph. The data was collected by Drop's card-linked marketing platform.

    With spending habits decreasing in 2023, low-price discounts are enough to entice consumers to purchase from a brand. 

    For every industry except Technology, most respondents (on average 36%) would be enticed by a 10-19% price decrease (lowest answer option). The lower discounts were more prominent for Grocery, Toiletry, Restaurant, and Personal Care brands (an average 40% of respondents). For Food Delivery, Entertainment, Travel, Clothing, and Technology, a 10-19% discount was still the most popular (an average 32% of respondents) but a higher share of respondents would also require a greater discount at 30%+ (average 37% of respondents). 

    Minimum Price Decrease Before Enticed to Purchase Vertical Stacked Column Graph.

    Companies in the Food Delivery industry look to have a challenge on their hands as consumers can only endure low price increases and require the highest discounts. For Grocery, on the other hand, consumers are willing to endure higher price increases and require low enticing discounts. This creates a perfect opportunity to leverage customer loyalty programs, consumers preferring to eat at home, and couponing which are popular approaches to combat the rising living costs.

    In an industry where price sensitivity varies across consumer behaviors, our card-linked marketing solutions enable you to entice customers effectively. With Drop’s Card Linked Offers, you will be better equipped to combat the challenges faced by the Food Delivery industry while capitalizing on the enduring demand for Grocery products. 

    Ready to seize the opportunity and maximize your business’s potential in the food service industry? Discover how Drop’s Card Linked Offers can help you navigate the dynamics of price elasticity and consumer preferences.

    Ready to get started?

    Tell us a little bit about how we can help.

      Unlocking the Power of Omnichannel Marketing in Retail

      The shopping landscape has undergone a significant transformation in recent years, catalyzed by the COVID-19 pandemic. What was once predominantly an in-store experience has now shifted to online platforms, and as we emerge from the pandemic, consumers are seeking a balance between the two. In this blog post, we will explore the changing shopping preferences and the growing importance of an omnichannel approach for organizations. Furthermore, we will discuss the unique advantages offered by both in-store and online shopping experiences, and how connecting the two can enhance customer satisfaction through personalization and consumer insights.

      Shopping behavior has shifted from predominantly in-store pre-covid, to online during covid, and now a combination of both post-covid. 

      The majority of consumers preferred to shop in-store pre-covid (54%), and during the pandemic, there was a necessary shift to online with approximately 20% making the switch. Now that consumers are free to shop how they please post-covid, the split between in-store, online, and both is fairly equal. It is evident that this trend is here to stay, underscoring the need for organizations to adopt an omnichannel marketing approach.

      With perks to shopping in-store and online that can’t be replicated by the other, consumers are getting the best of both worlds. 

      Most organizations have effectively created a good in-store and now also online shopping experience as a result of the pandemic. This is potentially a reason why consumer shopping preferences are more diverse. In-store, the ability to tangibly feel and try a product creates a confidence in the purchase which is hard to replicate online. Online, the ease of conveniently and seamlessly shopping anywhere, anytime, on any device is a feature that consumers have become accustomed to since the pandemic.

      Connecting the in-person and online shopping experience is what consumers desire most.

      Consumers are not looking for organizations to replicate the perks of in-store and online shopping within each other. Instead, the solution is to connect the two with an omnichannel marketing approach. Mobile phones are a great way to meet this need as stronger online personalization can be brought to the in-store experience. Reminding in-store shoppers of the products they have viewed online, and presenting the exact item location within the store through mobile phones is one example of how this could be executed.

      Meeting consumer preferences through omnichannel personalization.

      The majority of consumers like personalized recommendations as long as they are relevant and think more can be done within this space, especially in-store. Organizations have an opportunity to enhance the in-store shopping experience by leveraging the power of data and technology. By understanding customer preferences and purchase history through consumer intelligence, organizations can offer tailored recommendations, exclusive promotions like card-linked offers, and personalized assistance, thereby enriching the in-store experience and fostering customer loyalty.

      As shopping behavior continues to evolve, organizations must adapt and embrace an omnichannel approach to cater to diverse consumer preferences. The combination of in-store and online shopping experiences provides consumers with the best of both worlds, and by connecting these channels seamlessly, organizations can deliver personalized and engaging customer journeys. The future of retail lies in understanding consumer preferences and leveraging technology, customer intelligence, and consumer insights to create unique and memorable shopping experiences. By embracing an omnichannel strategy, organizations can thrive in this new era of shopping and build enduring relationships with their customers.

      Ready to go into the data? Unlock the potential of omnichannel marketing in retail by gaining exclusive insights and strategies with our presentation from RetailTO. Download our comprehensive presentation on data-driven omnichannel marketing now.

      Download the full Omnichannel Presentation

        How QSRs Can Adapt to Survive a Recession

        The Great Recession posed challenges for many industries including Quick-Serve Restaurants (QSRs) as consumer confidence and spending declined. However, some QSR chains were able to survive and even thrive by adapting to changing market conditions.

        How did QSRs survive the Great Recession?

        QSR chains like McDonald’s and Chipotle adapted to the changing market conditions to survive the economic downturn. McDonald’s saw an increase in sales due to its affordable menu options and value promotions. Meanwhile, Chipotle’s focus on healthy and fresh food options helped them to fare relatively well.

        McDonald’s + Chipotle Image

        The QSR industry was not immune to the Great Recession, but restaurants that could innovate efficiently were better equipped to survive and even thrive during this period.

        Consumer insights from Drop transactional data.

        Drop Transactional Data from 2022 and early 2023 reveals that QSR spend has been relatively consistent but started to decline in early 2023, similar to the Great Recession. Fast Casual spend follows a similar trend but being at a higher price point also experienced an earlier drop off in June of 2022. These trends are no surprise as economists are predicting Q1 of 2023 as potentially the beginning of another recession.

        QSR Industry Spend April 2022 - February 2023
        The Index approach uses the spend of base month (April, 2022) as the benchmark to showcase the changes of spend from each following month in comparison to the base month. This illustrates the trend in a simplistic manner, and enables the comparison of different categories under the same scale. For example, index 1.00 means the spend of a certain month is the same as the spend from April, 2022 and 2.00 means the spend of the certain month doubled the spend from April, 2022. 
        Fast Food: McDonalds, Chick-fil-A, Taco Bell, Wendy’s, Subway, KFC, Popeyes, Burger King. 
        Fast Casual: Chipotle, Five Guys, Qdoba, Panera Bread.

        Despite seeing a decrease in overall QSR spend, the average basket size has been consistent and even increased by approximately $1 for Fast Food restaurants. The marginal increase can be attributed to inflation and brands increasing their prices in the past 6 months. 

        The average frequency of purchases for Fast Food has also remained stable, except for a subtle dip in early 2023. This could be attributed to New Year’s resolutions to reduce fast food consumption. For example, the Fast Casual category continues to be very stable as brands like Chipotle are positioned as a healthier option.

        QSR Average Basket Size April 2022 - February 2023
        QSR Average Purchase Frequency April 2022 - February 2023

        What did we learn from our members about the future of the QSR space?

        Drop surveyed 1,300 card-linked members and found that 69% said they will spend the same amount on fast food in the next six months. However, 10% of respondents plan to spend more or much more because they are too busy to prepare food at home (40%), it’s convenient (40%) and it tastes good (29%). If QSRs introduce similar initiatives that were leveraged during the Great Recession like value meals, 28% (+18%) of respondents would purchase more fast food.

        QSR Purchase Frequency in the Next 6 Months

        Despite QSR basket size remaining steady, the decrease in the frequency of purchases is resulting in a decline for overall spend so far in 2023. From the Drop card-linked survey, around 80% of respondents will spend the same amount or more in the coming months on fast food. 

        If QSR brands want to capitalize on this sentiment and increase their share of wallet, they should look to the lessons from McDonald’s and Chipotle during the Great Recession. Similar to what was done in 2008-2009, QSRs should prioritize cheap and easy value items, emphasize the savings from coupons only found by downloading the brand’s respective app, and build on loyalty within the industry to maximize profits.

        The benefits of Drop card-linked offer programs for QSRs.

        With Drop’s Card-Linked Offers solution, QSR brands can offer personalized discounts and rewards to customers based on their spending behavior, leading to increased engagement and higher revenue. By adopting a card-linked offer program, QSRs can benefit from increased customer retention, improved consumer insights, and a competitive advantage in the market.

        Ready to maximize profits for your QSR brand? Start driving more sales and building customer loyalty today with Drop’s Card-Linked Offers solution.

        Sentiment towards Southwest and airline influential factors in 2023

        After a holiday season of increased cancellations and delays in late 2022, Southwest is trying to bolster its brand by promising to make good on inconveniences incurred by customers. CEO, Bob Jordan has pledged to “do better” and as a part of this promise, there are rumors that the company is planning to improve their infamous boarding process. 

        Drop surveyed 500+ members to gain consumer insights into the US airline industry:

        What is consumer sentiment towards Southwest Airlines and their top competitors?
What impact can Southwest Airlines expect by improving their boarding process?
Does the boarding process rank in the top factors that influence consumers?

        Despite 16,700 flight cancellations and severe delays during the 2022 December holidays, Southwest prevails as the top US airline amongst Drop survey respondents:

        Sentiment towards Southwest Airlines.
74% 
Satisfied with past Southwest experiences
78% 
Likely to fly Southwest in the future
43% 
Preferred Southwest to its competitors
15% 
Difference in preference between Southwest and second-place Delta

Drop Insights Solutions, Feb. 3, 2023, 528 US respondents.

        The proposed improvement to Southwest’s boarding process would increase the age of children in the ‘Family Boarding Group’ from 6 and under to 13 and under. 

        When Drop survey respondents were asked how this change would impact their sentiment towards Southwest the results were not positive, and it would be unwise for Southwest to introduce this rumored ‘improvement’:

        Sentiment on the Southwest boarding process.
24% 
Less likely to fly Southwest with proposed boarding process changes
35% 
Southwest’s boarding process is better than their competitors
32% 
Boarding process doesn’t impact which airline they chose

Drop Insights Solutions, Feb. 3, 2023, 528 US respondents.

        If it ain’t broke don’t fix it, and based on the example above, the boarding process doesn’t look to be a place for impactful wins. There are many other factors that have a much greater impact on which airline consumers are choosing. 

        The most important factor is the price which comes as no surprise in the current climate. 


        Just under 75% of respondents selected price as having the biggest impact on selecting an airline which was the highest factor by 13%. In order to compete with discounted industry pricing in January, Southwest will have no choice but to also offer low-fee fares despite facing a large cost of up to $825M due to the December holiday cancellations.

        Want to gain a deeper understanding of your industry that can give you a competitive edge? Check out Drop Market Research, and gain valuable insights with the help of market research surveys into your target audience and start making informed business decisions.

        Bringing Data Science to Retail

        Get a complete view of your customer, so no money is left on the table.

        The 21st century consumer’s path to purchase meanders through a stream of data and information. In today’s digital world marketers need to understand audiences and apply insights to deliver relevant experiences to their consumers. But that is not as easy as it sounds – Google and Apple are both significantly restricting the amount of information available to marketers by limiting the effectiveness of advertising cookies.

        Making informed decisions is now critical for marketers looking to deliver the most impact with their campaigns. Each company’s strategy will vary based on its business goals and their specific audiences, what remains true is the necessity for accurate and actionable data.

        Combining Datasets

        Data captured by a company typically only encompasses a few interactions with a digital advertisement or website engagement. Finding more insights on how a consumer interacts with a social media post and mobile app is possible but still we are missing critical pieces of the consumer experience. Building a complete vision requires the integration of all available data collected and will help achieve marketing objectives.

        But what if your company does not own those data sources? Partnering with a data specialist, like Drop for Business, will allow you to access that information – developing a more enriched image of the consumer.

        Uncovering data insights with a partner comes with many advantages. Drop for Business maintains a growing consumer dataset where members share their transaction data in exchange for monetary reward in the form of Drop points. This data encapsulates all of a consumer’s spend in various categories including competitive retailers, an avenue of data that is typically unknown to a company.

        Integrating Analytics

        Once a complete view of the consumer is generated it is time to use this information in decision making. Identifying valuable customer segments and applying them to marketing strategies turns insights into valuable actions:

        • Personalize customer experiences with audience-level data.
        • Segment customer bases to reach specific audiences with custom messaging.
        • Analyze marketing channel effectiveness and optimize budget allocation.

        Getting a more comprehensive understanding of consumer behavior leads to more effective marketing efforts. In turn, these efforts go on to improve the bottom-line performance of a business. Marketers with integrated technologies are more able to deliver experiences to consumers that delight each time they occur.

        How can Drop for Business help?

        Integrating more data into your marketing strategies enables you to gain actionable insights that prioritizes your business needs and understands your customers. For the best impact, the sources of the data must be reliable and up-to-date – Drop for Business currently provides a complete view of consumers from a combination of surveys and real-time, first-party data from billions of transactions, to truly understand your customer’s actions and future intent. With the data provided by our card-linked marketing platform, you can be sure to target the right customer, at the right time to supercharge your ROAS.

        Request a Demo

        Learn how your business can see these results too

          Winning Share of Wallet

          Strategies to winning the consumer’s attention and ultimately the sale.

          Strategies to Win Share of Wallet During Key Shopping Moments

          The consumer journey is a fundamental pattern that marketing and advertising strategists use to drive results. Shoppers today are inundated with influence and information coming from mixed media. What was once a direct shopping journey has been made an exploration, with the ease of access to information.

          As a result, advertisers must find ways to influence a sphere of customer journeys that lead to their brand and products. How?

          1. Aim to reach people, not personas

          Target people who are exhibiting signs of being in-market for a purchase. Typical strategies attempt to identify trends using a data set customized to their unique business. Understanding the indicators of a motivated shopper is not easy, but when done right enables marketers to close the sale.

          2. Deliver a quality experience

          It is key to ensure that the experience of your brand is high quality to make the shopping experience as seamless as possible. An easy experience is critical to building a base of brand loyalists.

          3. Always stay credible

          The multiple touchpoints between a brand and a shopper are each opportunities to build trust. To help, strive to anticipate consumer apprehensions and then address them during the shopping journey; ensuring that the message behind your brand is cohesive will help consumers make an informed decision that they can feel good about.

          4. Identify your moments

          While it is easy to identify that a prospect is actively searching for your product online, it is not always easy to understand where the shopping journey started. The desire to make a purchase can stem from a moment not directly related to the product – understanding these moments enables marketers to double-down on what is working.

          People make deliberate decisions about shopping, weighing many individualized factors to make their choices. With abundant information available online, it is now the objective of the advertisers and marketers to generate a holistic strategy that caters to the fragmented journey outside of their own digital properties.

          Gaining a view into the activity and actions of a consumer requires insight about their daily lives outside of interactions with a specific brand environment. In addition to making great content, it must be delivered to consumers at a time that matters to them outside of the traditional shopping journey. A prospective consumer that discovers content should be able to relate to the content as well as find it useful and trustworthy – keeping the brand top of mind for a purchasing decision.

          How can Drop for Business help?

          Many marketers are partnering with companies that specialize in connecting consumers with products and services that are specific to their needs. Drop for Business has over 5 million members that receive their own tailored content which is most relevant to their lives. Members choose to share their shopping behavior with Drop in exchange for Drop points, ensuring a clear exchange of value and maintaining trust between the member, Drop, and our brand partners.

          With this data, Drop for Business is positioned to segment, target and tailor content to meet consumers at these unique key shopping moments and ensure an efficient conversion of lapsed shoppers while maintaining a healthy relationship with loyal shoppers. By maximizing this strategy, marketers are able to promote customer loyalty as well as attain more customers, thereby increasing share of wallet.

          Request a Demo

          Learn how your business can see these results too

            Driving Scale with Card-linked Offers

            Drive 10x more scale than affiliate offers – here’s how to do it.

            Card-linked offers (CLO) are a great tool to drive in-store activations and reward your most loyal customers. But that is not the only reason why they’re becoming more popular with business and consumers alike. CLOs with Drop for Business have proven to drive 10x more scale than affiliate offers – here’s how it works.

            Affiliate Marketing

            Affiliate marketing is an advertising model where publishers (such as Drop) earn a commission for successfully promoting a product or service for an advertiser (ie. brand or merchant). The publisher is rewarded a payout for providing the result desired by the advertiser, usually the sale of a product.

            Affiliate marketing attribution is tracked via unique web URLs, capturing data points that inform the advertiser where the end-customer originated from and attributes the sale to the publisher responsible for attracting the customer to make their purchase.

            While affiliate marketing has been an extremely successful approach for direct to consumer and ecommerce businesses, traditional brick and mortar businesses struggle with associating online marketing activity to offline purchases.

            Card-Linked Marketing

            A new advertising channel gaining popularity with the rise of open banking is card-linked marketing (CLM). CLM operates similarly to affiliate marketing, with the key difference being publishers and advertisers attribute customer purchases using the bank-level transaction details, rather than web URLs. Card-linked offers are capable of measuring both online and offline purchases, and gaining traction with omni-channel and brick and mortar marketers.

            Benefits of Card-Linked Marketing

            Card-linked offers (CLOs) are the most popular way in which consumers choose to interact with brands on Drop and, as a result, they consistently unlock 10x more scale than affiliate offers.

            Card-linked offer attribution has historically been a challenge for marketers because purchases are measured in the bank environment as opposed to tracking click activity. Advertisers are accustomed to a 1-to-1 marketing attribution known as “Last-click Attribution”, where the last Publisher to receive a click from the consumer is granted commissions for the sale.

            But with Drop Pulse, our partner success tool, marketers get the best of both worlds, the increased scale of CLOs with the same last-click attribution as affiliate offers.

            Attribution with Drop Pulse

            Drop bridges the gap with a unique click ID that correlates the card-linked offer activation to the consumer’s transaction; Drop For Business is able to provide 1-to-1 tracking data to brand partners, accessible through Drop Pulse. CLO click attribution by Drop for Business is an order-of-magnitude improvement in marketing reporting that allows marketers to measure when the digital offer activation occurred and correlate it to the resulting online or offline purchase.

            At Drop for Business, we empower marketers to drive cost-efficient advertising campaigns by targeting the right customers, at the right time. Get in contact with our team and find out how Drop for Business is able to leverage CLO click attribution to exceed your advertising goals.

            Request a Demo

            Learn how your business can see these results too