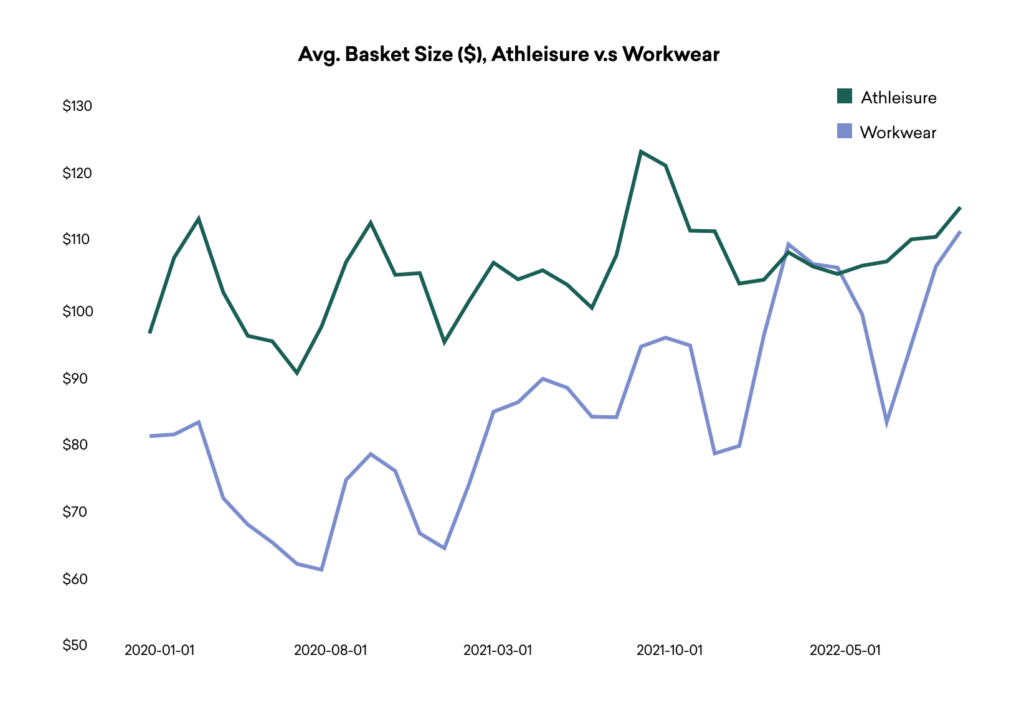
Our Q1 Spending Report that we shared earlier this year showed that overall spend was down in every sector except for travel compared to last year. The basket size in the travel sector increased 4% whereas the transaction volume was relatively flat showcasing the inflation of travel prices. The rising travel costs are concerning consumers and highlighting the importance for travel organizations to strategize price points and provide additional value where possible. Airbnb experienced a financial dip due to these recent economic uncertainties and strong competition, but could June be the month to bounce back? Read on to find out!
Spending in the travel sector has increased compared to last year, but more so due to inflated prices rather than vacation volume as travelers are concerned about rising costs.
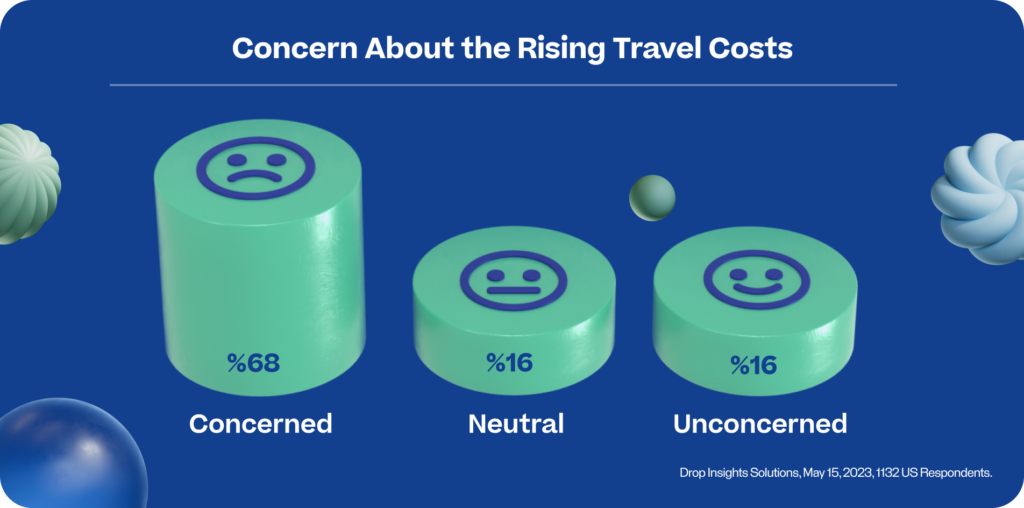
Drop’s card linked offers platform enables us to capture real-time consumer insights through surveys like our most recent one on the travel accommodation space. Of the market research survey respondents, 68% are concerned about the rising travel costs impacting their ability to take leisure trips. Inflated travel prices are the top reason contributing to the ease of travel among US vacationers (75% of respondents) and lingering health and safety concerns are also still playing a role post pandemic (30% of respondents). Staycations and localized traveling have become a more popular option in recent times (46% of respondents) providing low and transparent prices which are at least moderately important for 69% and 86% of survey respondents respectively. Demand for low prices and localized traveling should be a market well suited to travel organizations like Airbnb, but a recent financial dip could be due to strong competitors who are able to provide better value.
With the increased importance of price points and loyalty programs, Airbnb has strong competitors which are enticing alternatives for travelers.
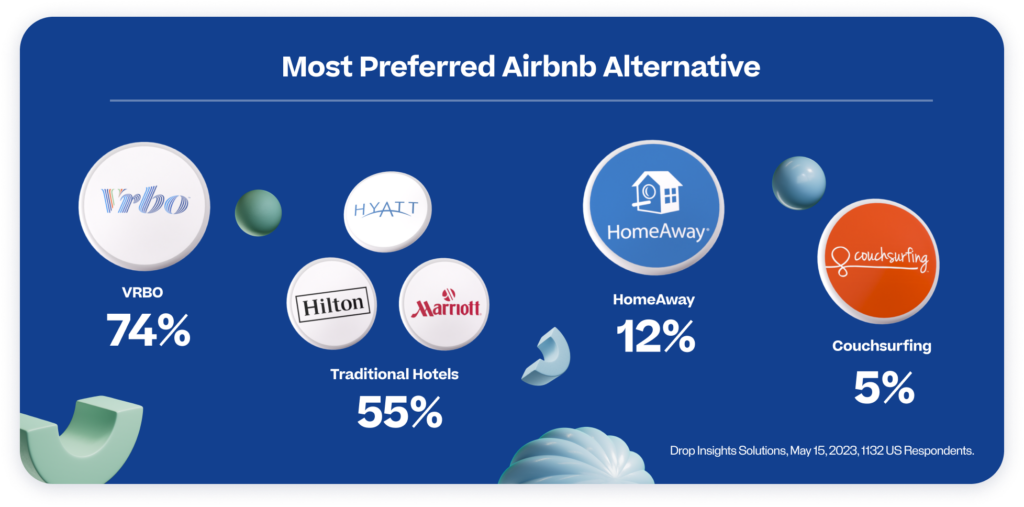
When asked about alternatives to Airbnb, the stand out option is VRBO for 74% of survey respondents. The company operates in a similar fashion to Airbnb but typically offers lower prices for the same accommodation and has superior customer service. VRBO experienced a similar financial dip to Airbnb recently but is set to launch its loyalty program ‘One Key’ in early July, hoping to provide even more value to their travelers in exchange for reliable commitment. After VRBO, traditional hotels are the most preferred alternative for 55% of respondents. This is primarily due to the features unique to a hotel experience like amenities and services but also the loyalty programs and rewards points that many hotels offer. With price points and loyalty programs continuing as top priorities to travelers, VRBO and many hotels look to be in a better position compared to Airbnb.
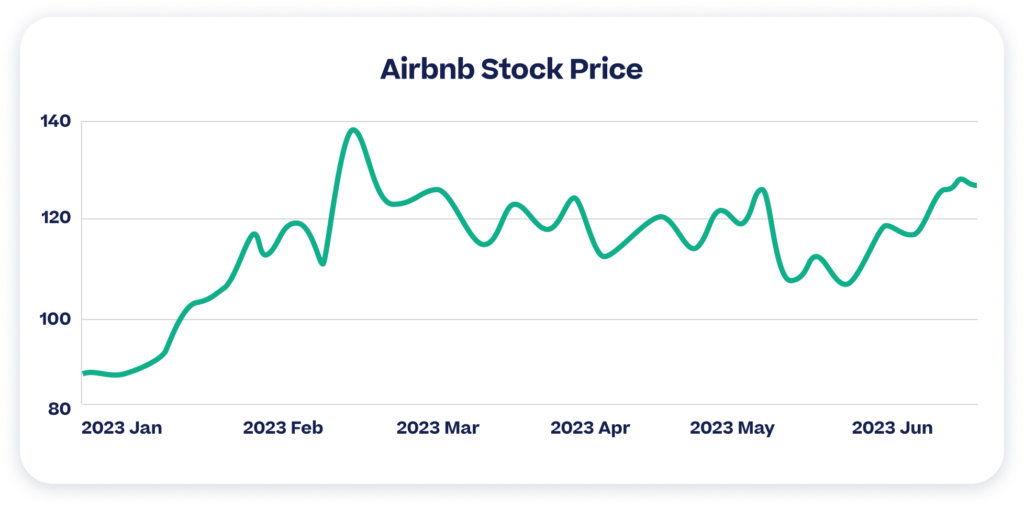
Despite economic uncertainties and strong competition, Airbnb looks to be bouncing back in June with its highest stock price since early February.
The Airbnb stock price fell 21% from May 9th – 12th and this financial dip is reflected in the survey results as only 9% of the survey respondents are likely to invest in Airbnb’s stock. The economic uncertainties are affecting many organizations in the travel sector, and 56% of the respondents believe Airbnb is being at least moderately affected during this ease of US travel. It also doesn’t look to be getting any easier for Airbnb, as 44% of the respondents are likely to use hotels more frequently in the future instead. The odds look to be against Airbnb at this moment in time with the economic uncertainties and strong competitors in the industry, but despite all of this Airbnb could be bouncing back this month as their stock price is the highest it has been since early February. Focussing on their homier feel, evolving where possible, and optimizing their price points will be imperative to keep this momentum going.
Looking for similar consumer insights or competitive analysis into a different industry? Fill out the form below or reach out to sales@joindrop.com to leverage our card linked offers platform.
Ready to get started?
Tell us a little bit about how we can help.
This site is protected by reCAPTCHA and the Google Privacy Policy and Terms of Service apply.